L) to see the workflow’s run history.
The run list
Each row shows the run’s status, what triggered it, its message, when it ran, and how long it took.| Column | Values |
|---|---|
| Status | Success, Error, Running, Waiting |
| Trigger | Manual, Schedule, Webhook, Email, Form, API |
| Message | The run’s result or error message |
| Time and duration | When it started and how long it took |
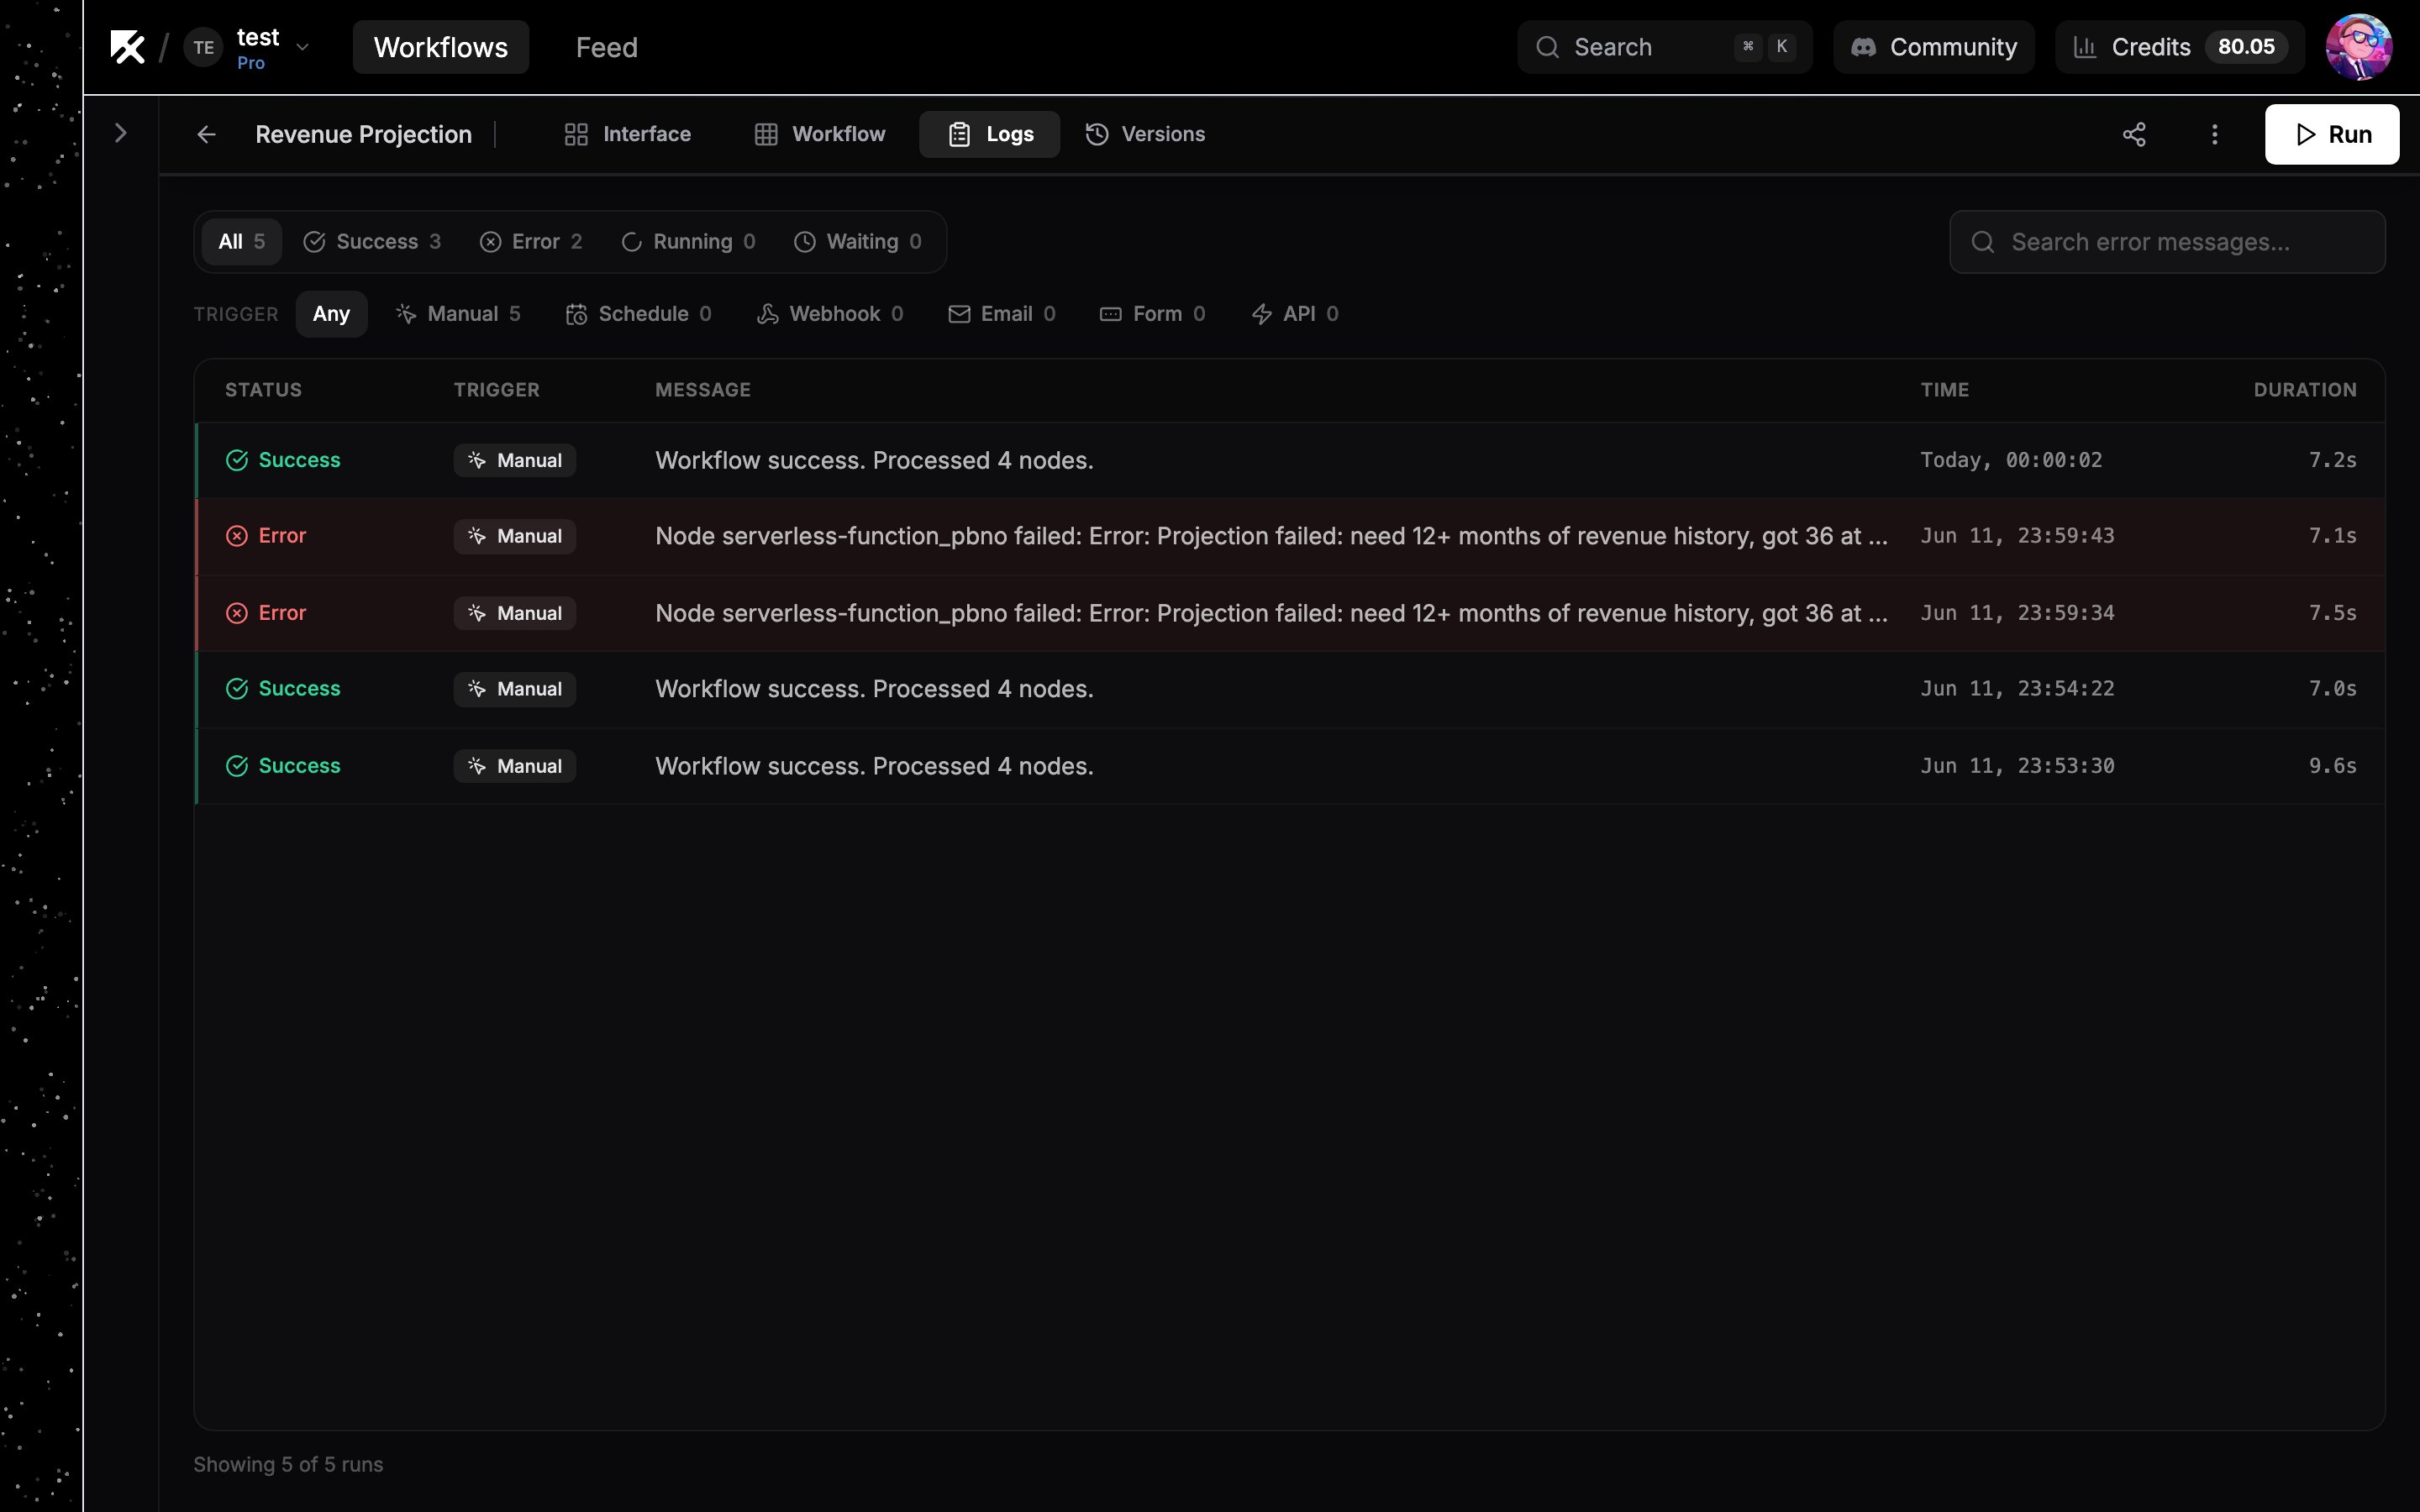
Runs are retained for 14 days or the most recent 25,000 runs per workflow, whichever limit is reached first.
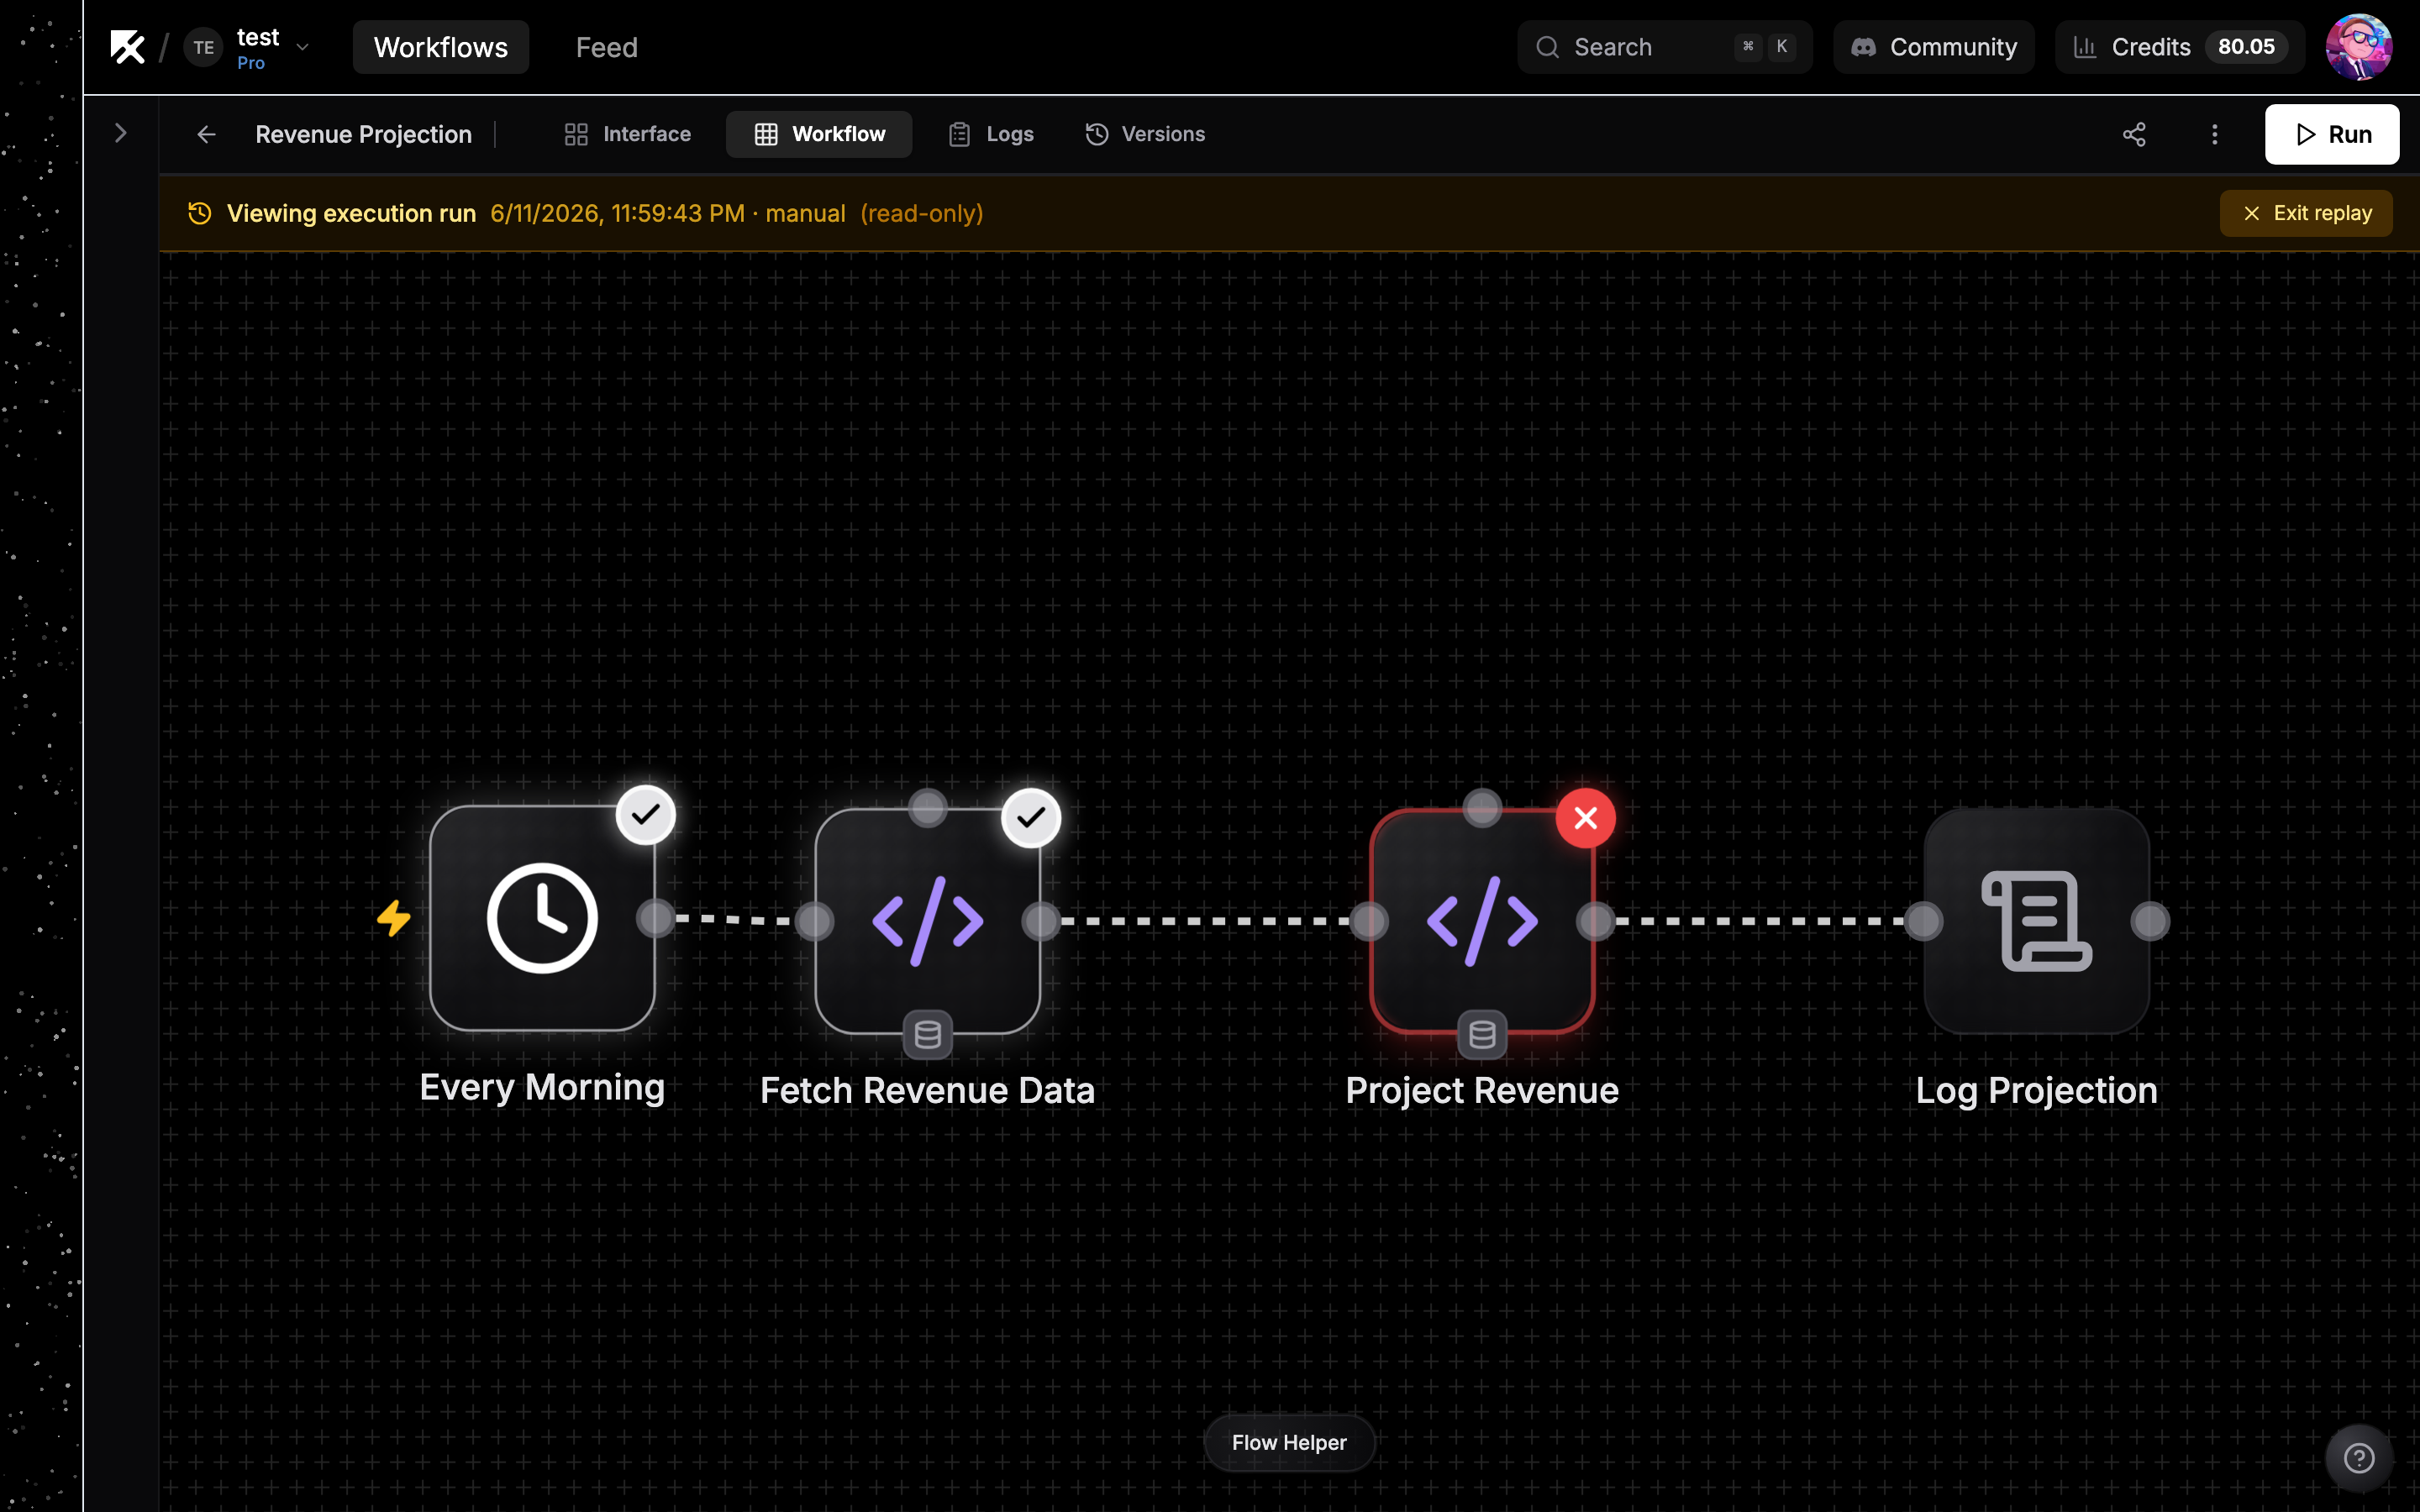
Replaying a run
Click any run row and the canvas renders that execution’s exact graph snapshot, read-only, under an amber “Viewing execution run” banner. This is the graph as it was when the run happened, even if you’ve edited the workflow since. In replay mode:- Nodes carry success or error rings showing how each step ended.
- Click a node to see the inputs it received and the output it produced.
- Agent runs show a tool calls panel listing each tool call with its arguments, result, and duration.
L to jump back to the list and pick another run.
Next steps
Running and testing
Run nodes individually while you build.
Error handling
Route failures down dedicated branches.