> ## Documentation Index
> Fetch the complete documentation index at: https://docs.noclick.com/llms.txt
> Use this file to discover all available pages before exploring further.
# Running and testing
> Run the whole workflow or a single node, inspect outputs, and pin mocked outputs to build downstream without re-running.
## Run the whole workflow
Click **Run** in the top right (or press `Shift` + `R`). While a run is in progress the button becomes **Stop**; if several runs are active it becomes a **Stop (N)** dropdown where you can stop one run or **Stop all**.
If a workflow only starts on its own, with triggers like an incoming email, a new row, a schedule, or a webhook and no manual entry point, pressing **Run** opens a popup that explains it runs automatically. The popup lists what each trigger watches and the address or URL that fires it. From there you can **Add a Run step** to add a manual entry point, **Open config** for any trigger, or **Run anyway** to do a single manual run. See [Triggers overview](/triggers/overview).
When you **Run anyway** on a workflow whose webhook or inbound-email trigger has already fired at least once, the trigger replays its last received event so the rest of the flow has real data to work with. A trigger that has never fired runs as before.
## Before running
If any step still needs setup, **Run** opens a popup that walks you through them one at a time, with a progress bar you can click to jump around. A pill at the top counts what is left ("2 nodes need setup") and turns into **Ready to run** once you clear them. A step appears here when it is missing a required field, has no action selected, has no account connected, or is a [tool provider](/agents/tools) with no operations allowed yet.
You fix each one in the popup itself:
* **Missing fields** get the same editors as the config panel, including dropdowns that load their options from the connected account.
* **No action selected** gets the node's action picker. Until an action is picked, which fields the node needs is unknown, so this comes first.
* **No account** gets the node's credentials block. Connecting through OAuth opens the provider window with the popup still up, and the block flips to done when the credential lands.
* **A tool provider with nothing allowed** gets its operation list, so you can tick the operations the agent may call.
Requirements stay listed once you satisfy them, marked as done, so a block never disappears mid-edit. The run action is always available: it reads **Run anyway** while something is unfilled and **Run** when everything is set. **Open config** on any step takes you to that node on the canvas instead.
This check also runs before a single node run and before **Run from here**, over the nodes those runs actually touch, which includes upstream nodes whose data is [referenced](/editor/data-references) and any tool providers wired into an agent that runs. On mobile, **Run** starts the run without the popup.
## Choose where a run starts
When a workflow has more than one entry point, the popup also asks which of them to start from. Each row names the branch it begins, such as "Then Slack, Gmail" or "Uses Telegram", and you untick the ones to leave out. Untick everything and **Run** is disabled. With more than two entry points, **Select all** and **Clear** appear.
An agent entry point gets a box for its opening message, prefilled from the agent's **Message** field, so you can adjust what it does on this run without editing the node. When the agent is the only entry point you run, its answers arrive in the chat, which opens as soon as the run starts. With another branch ticked too, the run stays on the canvas and the agent's answer lands on its node.
This screen appears when there is a choice to make or an agent message to write. A workflow with one non-agent entry point runs straight off the button. Workflows that only start on their own show the trigger popup described above instead.
## Run results
When a run finishes, a results popup shows what each node produced. A left rail lists the nodes that ran, each with a status icon, and the main panel shows the selected node's output. For an AI agent, you see its final response along with the tool calls it made. Use **Open config** on any node to jump straight to its settings.
The popup opens on its own after a full run, a **Run from here** run that starts partway through the flow, and runs started by a trigger such as a schedule or a webhook. To stop it from opening automatically, click **Don't show again**; turn it back on under **Settings** in the **Popups** section. These popups do not appear on mobile.
The **Runs** pill on the top left of the canvas is always available, even before this session's first run. It shows the latest run's status and how long ago it ran, and clicking it reopens the results popup. Inside the popup, a run switcher lets you load any earlier run and review its outputs, scrolling back through your run history without leaving the canvas.
## Run a single node
Testing one node at a time is usually faster than full runs:
Click it on the canvas to open the config panel.
Click **Run** in the config panel's toolbar (or press `Cmd/Ctrl` + `Enter`).
If the node reads from upstream nodes that haven't produced output yet, the Run button is disabled ("Missing input data from previous nodes"). Run the upstream nodes first, or mock their outputs.
## Inspecting input and output
With a node selected, toggle **Output** (`Y`) to see what it produced, in field, JSON, or table view, and **Input** (`X`) to see the data arriving from connected nodes. Every value in these panels is draggable into downstream config fields as a [reference](/editor/data-references).
 ## Mocked outputs
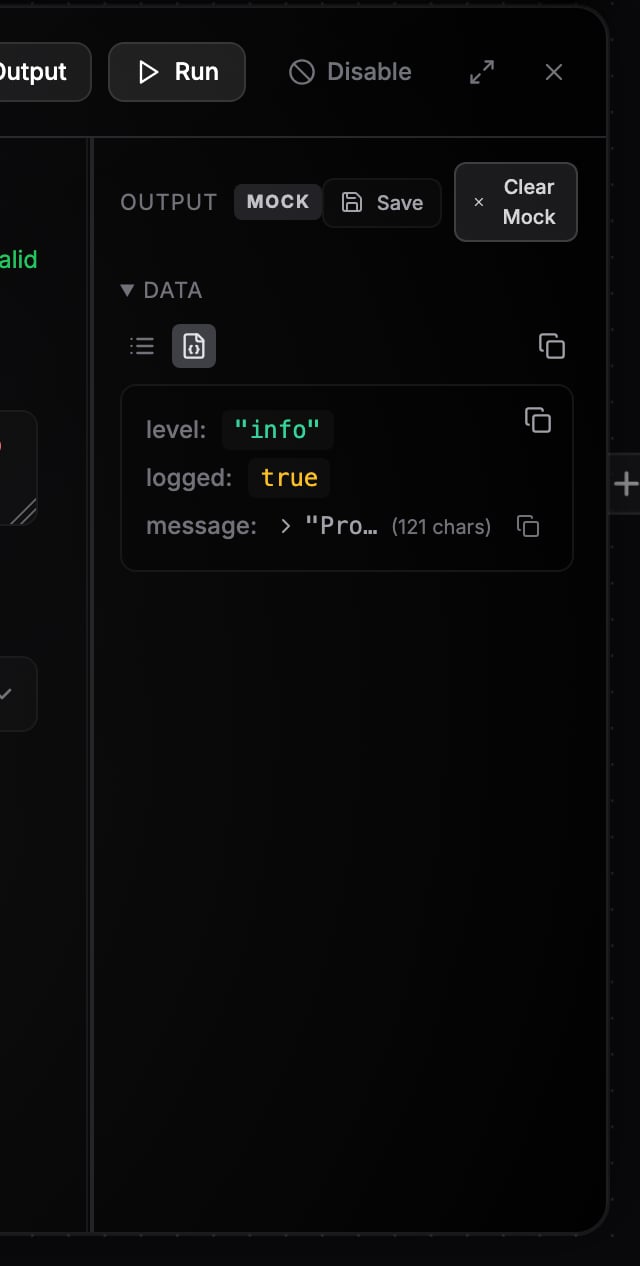
Click **Mock** (the pin icon) in the Output panel to pin the currently displayed output as the node's mocked output. The node then shows a **MOCK** badge, and downstream nodes use the pinned data without the node re-running, so you can build and test the rest of the workflow against a stable sample. Click **Clear Mock** (or press `M` with the node selected) to go back to live output.
**Save** stores the current output under a name so you can reload it as mock data later (3 saved outputs per type on Free, 10 on Plus, unlimited on Pro).
You can also pin a node's output without opening the Output panel: hover the node and click the **pin** button on its top-left edge. It stays highlighted while the output is pinned, and you click it again to clear. The button is available once the node has produced output.
## Execution states on nodes
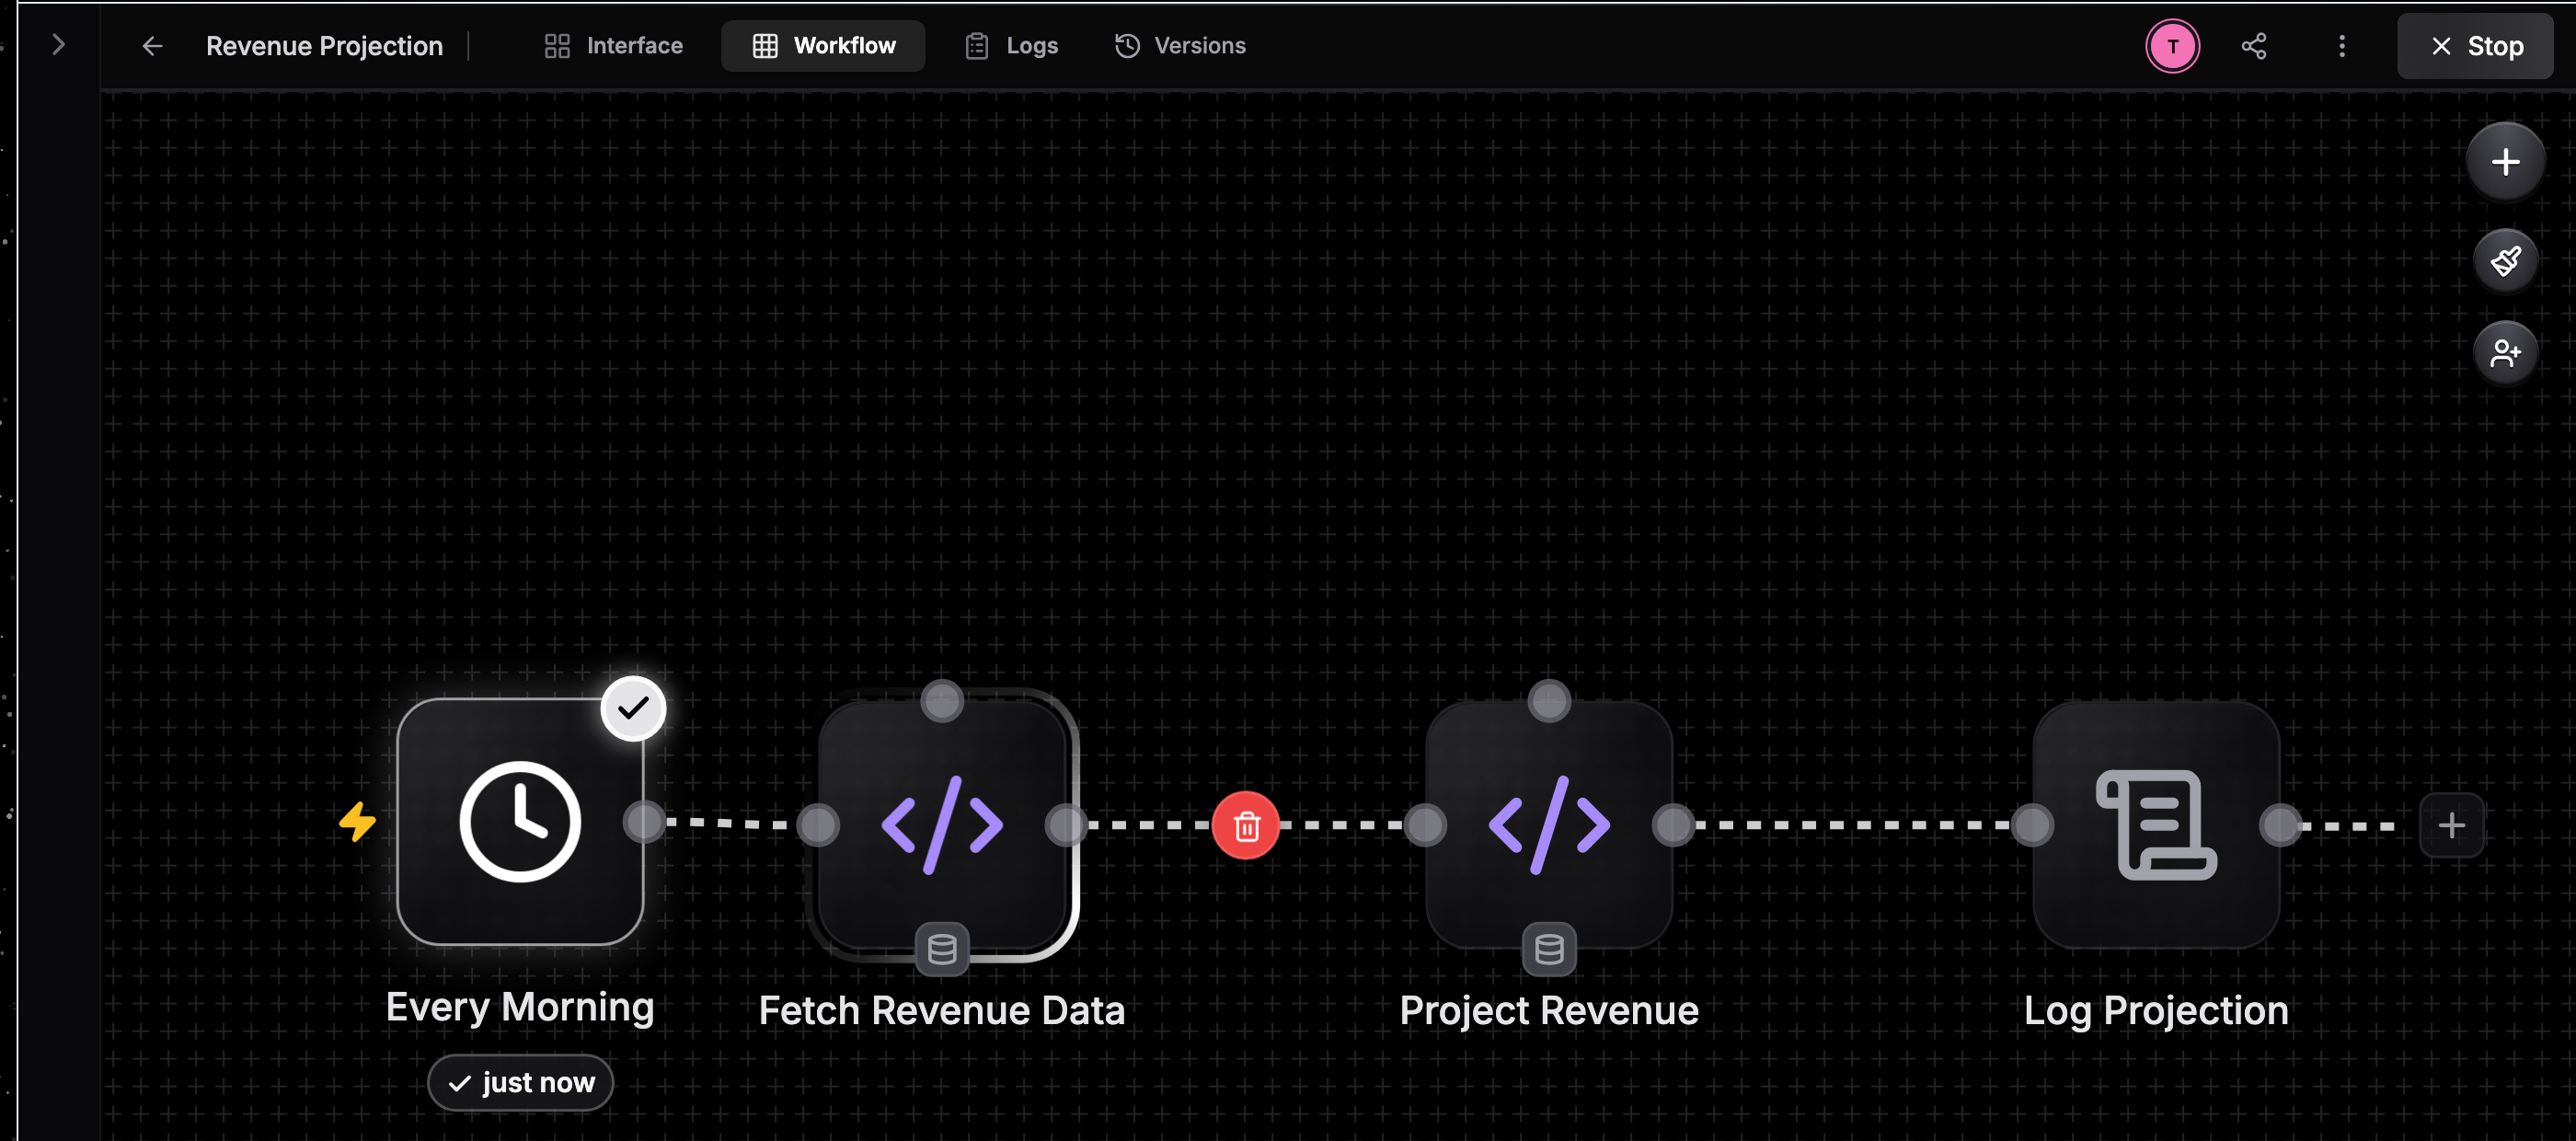
Nodes reflect the run live on the canvas: a node animates while it is `running`, settles when `completed`, and shows error styling when it fails. Disabled nodes are skipped entirely. Toggle a node off with `D`, or hover it and click the **disable** button on its bottom-left edge; a disabled node greys out and the button turns amber until you enable it again.
## Mocked outputs
Click **Mock** (the pin icon) in the Output panel to pin the currently displayed output as the node's mocked output. The node then shows a **MOCK** badge, and downstream nodes use the pinned data without the node re-running, so you can build and test the rest of the workflow against a stable sample. Click **Clear Mock** (or press `M` with the node selected) to go back to live output.
**Save** stores the current output under a name so you can reload it as mock data later (3 saved outputs per type on Free, 10 on Plus, unlimited on Pro).
You can also pin a node's output without opening the Output panel: hover the node and click the **pin** button on its top-left edge. It stays highlighted while the output is pinned, and you click it again to clear. The button is available once the node has produced output.
## Execution states on nodes
Nodes reflect the run live on the canvas: a node animates while it is `running`, settles when `completed`, and shows error styling when it fails. Disabled nodes are skipped entirely. Toggle a node off with `D`, or hover it and click the **disable** button on its bottom-left edge; a disabled node greys out and the button turns amber until you enable it again.
 ## Next steps
Review past runs and replay them node by node.
Run workflows automatically from schedules, webhooks, and more.
## Next steps
Review past runs and replay them node by node.
Run workflows automatically from schedules, webhooks, and more.